The alloy was heat treated to three different temper conditions:
i. Solubilisation (S): 965 ºC for 1 hour followed by oil quenching.
ii. Peak aging precipitation (P): following solubilisation treatment, 720 ºC during 8 h followed by 2 h cooling time towards 620 ºC and then, 620 ºC during 8 h and air cooling.
iii. Overaging (O): after peak aging precipitation, 800 ºC during 36 h followed by furnace cooling.
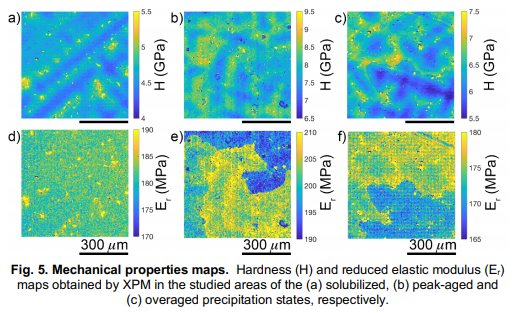
Optical micrographs of the cast Inconel™718 alloy are presented in Fig. 1a and b. The microstructure was characterized by large irregular grains in the millimetre size range. As typically occurs during solidification, each grain develops by dendritic growth, leaving behind interdendritic regions decorated by coarse second phase particles, mainly δ (Ni3Nb), MC carbides and Laves phases, as shown in Fig 1c. The volume fractions of MC carbides, Laves phases and δ needles were 1.3%, 0.6% and 4.4%, respectively. The secondary dendrite arm spacing was 157 µm ± 23 µm.
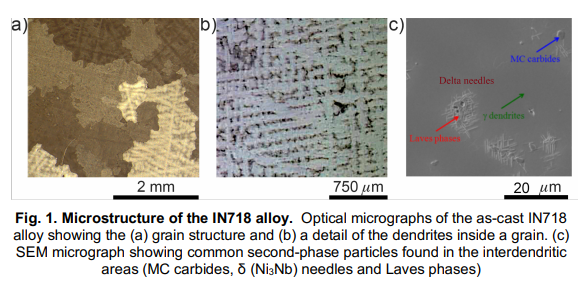
The measurement area in each temper condition, of size 640 µm x 640 µm comprised one or a few grains, as shown in the EBSD maps of Fig 2.a, b and c for the solubilised, peak-aged and overaged precipitation states, respectively, where the colour code indicates the crystallographic direction of the surface normal in each case.
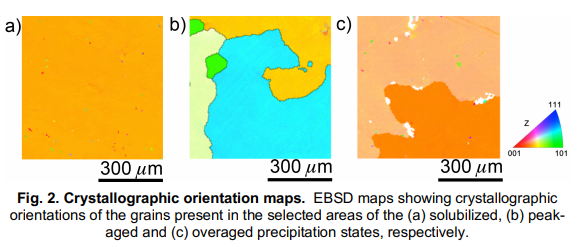
Due to the different diffusion rates of each chemical element, chemical segregations are expected in the cast material at the dendrite scale. Fig. 3 shows the compositional maps in the three representative areas for the seven most important alloying elements of this alloy: Ni, Cr, Fe, Mo, Al, Ti and Nb. The maps show that Ni presented a slight segregation towards the interdendritic spaces and that it was absent from the second-phase particles found in the interdendritic areas. On the other hand, since the diffusion of Cr and Fe is slower than other elements [7,8], they tended to be localized in the dendrites core region. In the case of Mo and Al, their content was lower than the other elements and were homogeneously distributed along the different microstructure features. On the contrary, Ti segregated strongly to the interdendritic areas, taking part on the formation of the second phases particles present in these regions, mainly MC carbides. Finally, Nb segregated towards the dendrites outer region, into the interdendritic area and the second-phase particles. As a result, and even though the average Nb content was 5.1 wt.%, the Nb content of the dendrite core was as low as 2 wt.%, while the Nb levels in the interdendritic regions, away from the second-phase particles, reached 8 wt.%. The Laves phases and δ needles appeared as islands containing about 25 wt.%Nb. No significant differences in terms of chemical segregation were found with temper condition, which indicates that the temperatures and times were not high or long enough, respectively, to homogenise the chemical composition.
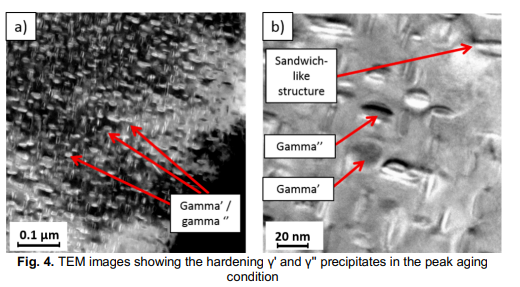
Finally, the precipitates in the peak aged condition were characterized by TEM. The alloy matrix comprises a FCC � phase consisting on a Ni based solid solution. The � matrix is strengthened by an intermetallic FCC �’ phase with composition Ni3(Ti ,Al) and a BCT �’’ phase with composition Ni3Nb formed during ageing [9]. Fig.4 shows TEM images of the specimen in the peak aged condition at different magnifications. The �’’ precipitates exhibit an elongated disc shape, whereas the �’ precipitates are almost spheroidal. Both had an average size of 20 nm. The presence of complex precipitates comprised of two half-spheroidal �’ particles sandwiching a �’’ disc-shape precipitate could also be observed, as shown in Fig. 4b.
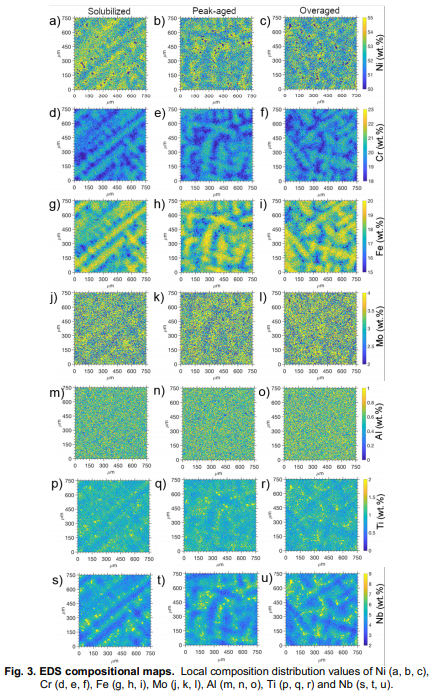
2.2.- Mechanical properties The hardness (H) and reduced elastic modulus (Er) maps for the solubilised, peak-aged and overaged precipitation state are shown in Fig. 5 a-c and d-f, respectively. The average hardness values, without considering the second phase particles, were 4.7, 7.8 and 6.2 GPa for the solubilised, peak-aged and overaged temper, respectively. However, the hardness values showed a strong gradient at the dendrite scale, with lower values within the dendrite cores that tend to increase towards the interdendritic regions (Fig. 5.a-c). The hardness difference between the dendrite core and the interdendritic region was as high as 2 GPa, depending on temper condition. Additionally, the second phases located in the interdendritic spaces, mainly MC carbides, presented the highest hardness values (up to 30 GPa).
